5 Best Alternatives to StockCharts for Web in 2026
By Noahlast updated pricing verified
All 5 StockCharts alternatives
Compared: StockCharts alternatives that run on Web
| Alternative | Best for | Learning curve | Price |
|---|---|---|---|
| StockChartsreference | running end-of-day technical scans on US stocks and ETFs and reviewing the results in saved chart lists | Moderate | Free tier · paid from $18.42/mo |
| TradingView | Multi-asset charting and technical analysis with custom Pine Script indicators, strategy backtests and alerts synced across web, desktop and mobile | Moderate | Free tier · paid from $12.95/mo |
| TrendSpider | Automating trendline, pattern and multi-timeframe analysis on US stocks, then backtesting and alerting on those signals without writing code | Steep | From $82/mo |
| Finviz | Screening US-listed stocks and ETFs by fundamental and technical filters and reading the day's market moves on heat maps | Low | Free tier · paid from $24.96/mo |
| Tickeron | Getting machine-generated entry, target and stop ideas for US stocks and ETFs from AI robots and pattern scanners instead of charting setups by hand | Moderate | Free tier · paid from $20/mo |
| SnapPChart | Getting a second opinion on a momentum or breakout setup from a chart screenshot right before entering a trade | Low | From $4.99/mo |
 StockCharts
 TradingView
 TrendSpider
 Finviz
 Tickeron
 SnapPChart
1TradingView — best StockCharts alternative for multi-asset charting and technical analysis with custom Pine Script indicators, strategy backtests and alerts synced across web, desktop and mobile

TradingView is the best StockCharts alternative for chartists who want strategy backtesting and native apps without paying more. TradingView backtests Pine Script strategies directly on the chart, where StockCharts has no automated backtesting and tests setups by running scans as of past dates. TradingView ships 400+ built-in indicators and more than 100,000 community scripts, screeners across 150+ exchanges in 50+ countries with 500+ fundamental and technical fields, bar replay, paper trading and order placement through brokers such as OANDA, NinjaTrader and FOREX.com. TradingView runs on web, Windows, macOS, Linux, iOS and Android, and its iOS app holds 4.8/5 from about 420,000 ratings, against StockCharts' 2.8/5 from 49 and no Android app. Essential costs $12.95/month billed annually ($14.95 month to month), below StockCharts Basic's $18.42 ($19.95), and allows 20 price and 20 technical alerts against Basic's 2 price alerts and 1 advanced alert. StockCharts is still the better choice for end-of-day scanners and classic chart readers: StockCharts schedules daily scans of 50,000+ symbols on Extra and PRO, builds Point & Figure and Relative Rotation Graph charts, keeps price history back to 1900 on PRO, and includes ChartSchool and members-only commentary from analysts such as David Keller and Martin Pring. TradingView's free plan also allows only 2 indicators per chart against StockCharts Free's 3.
Compared to StockCharts: strategy backtesting on the chart where StockCharts has none, apps for web, Windows, macOS, Linux, iOS and Android against web and iOS only, and Essential at $12.95/month with 20 price and 20 technical alerts against Basic's $18.42 with 2 price alerts
Wins:Backtests Pine Script strategies on the chart and adds bar replay and paper trading, where StockCharts tests setups by running scans as of past dates · Runs on web, Windows, macOS, Linux, iOS and Android with an iOS app rated 4.8/5 from about 420,000 ratings, against StockCharts' web app and 2.8/5 iOS app with no Android version · Essential costs $12.95/month billed annually with 20 price and 20 technical alerts, against StockCharts Basic at $18.42 with 2 price alerts and 1 advanced alert
Loses:No scheduled daily scans, Point & Figure charts or Relative Rotation Graphs in TradingView's listing, all core StockCharts tools · No equivalent in the listing of StockCharts' ChartSchool tutorials or members-only commentary from analysts such as David Keller, Martin Pring and Larry Williams · Free Basic plan allows 2 indicators per chart against StockCharts Free's 3 indicators and 3 overlays, and real-time NASDAQ, NYSE and CME data costs extra
Pros
- 400+ built-in indicators and 100,000+ community scripts in Pine Script cover nearly any technical study.
- Layouts, watchlists and alerts sync across the web app, Windows, macOS and Linux desktop apps, and iOS and Android.
- Screeners span 150+ exchanges in 50+ countries with 500+ fundamental and technical fields.
- The free Basic plan has no time limit or card requirement, and paper trading and broker order routing are built in.
Cons
- Real-time feeds for exchanges such as NASDAQ, NYSE and CME cost extra on top of any plan.
- Basic plan limits: 1 chart per tab, 2 indicators per chart, 3 price alerts and 5,000 bars, with ads.
- Refunds apply only to annual plans within 14 days of payment; monthly plans and market data are non-refundable.
- Subscribing through the iOS app costs more: Essential lists at $21.99 there versus $14.95 month to month on tradingview.com.
Pricing: Free tier · paid from $12.95/mo — TradingView Essential at $12.95/month billed annually ($14.95 month to month) vs StockCharts Basic at $18.42/month billed annually ($19.95 month to month) (verified )
2TrendSpider — best StockCharts alternative for automating trendline, pattern and multi-timeframe analysis on US stocks, then backtesting and alerting on those signals without writing code

TrendSpider is the best StockCharts alternative for active traders who want the testing StockCharts leaves out. StockCharts has no automated strategy backtesting, so members test a setup by running scans as of past dates and reviewing results by hand; TrendSpider runs a no-code strategy tester backed by 50+ years of market data. TrendSpider also detects trendlines, Fibonacci levels, chart patterns and candlestick patterns automatically across timeframes, alerts on drawn trendlines, runs trading bots through SignalStack and connects to 30+ brokerages and crypto exchanges. Real-time US equity, ETF, forex and crypto data is included for non-professional users, where StockCharts charges $9.95/month per market for official real-time data, and TrendSpider ships iOS and Android companion apps where StockCharts has no Android app. StockCharts is still the better choice on price and for end-of-day work: StockCharts has a free plan and Extra costs $27.65/month billed annually for 10 scheduled scans and 100 advanced alerts, against TrendSpider Standard's $54-$89/month for 3 scheduled scans and 10 alerts lasting 30 days, plus a non-refundable $19 trial. StockCharts also covers Canadian, UK and Indian stocks, keeps price history back to 1900 on PRO, and has a moderate learning curve against TrendSpider's steep.
Compared to StockCharts: a no-code strategy tester on 50+ years of data where StockCharts has no backtesting, real-time US equity data included instead of $9.95/month per market, and Standard at $54-$89/month with 3 scheduled scans against Extra's $27.65 with 10
Wins:No-code strategy tester backed by 50+ years of market data, where StockCharts tests setups by running scans as of past dates and checking results by hand · Automatic trendline, Fibonacci and pattern detection, dynamic alerts, trading bots and 30+ connected brokerages and crypto exchanges · Real-time US equity, ETF, forex and crypto data included for non-professionals, plus iOS and Android apps, where StockCharts charges $9.95/month per market and has no Android app
Loses:No free plan and a non-refundable $19-$49 trial, where StockCharts has a free plan · Standard renews at $54-$89/month for 3 scheduled scans and 10 alerts lasting 30 days, against StockCharts Extra at $27.65/month billed annually with 10 scheduled scans and 100 advanced alerts · Steep learning curve against StockCharts' moderate, and no listed coverage of Canadian, UK or Indian stocks or price history back to 1900
Pros
- Detects trendlines, Fibonacci levels, chart patterns and candlestick patterns automatically across timeframes.
- No-code strategy tester backed by 50+ years of market data, with trading bots and SignalStack order routing.
- Real-time US equity, ETF, forex and crypto data is included for non-professional users.
- Every plan includes every feature; tiers differ only in capacity limits.
- Connects to 30+ brokerages and crypto exchanges for trading from the platform.
Cons
- No free plan; the 14-day trial costs $19-$49 and is non-refundable.
- Standard limits are tight: 10 alerts lasting 30 days, 5 bots and 2-hour backtest granularity.
- Sidekick AI beyond 25 messages a month costs $49-$349/month, and futures ($7.50/month) and options ($9.50/month) data are extra.
- Mobile apps are companions to the web platform, and new users are told to set up on a computer first.
Pricing: From $82/mo — TrendSpider Standard renewing at $54-$89/month ($82 list) vs StockCharts Extra at $27.65/month billed annually ($29.95 month to month) (verified )
3Finviz — best StockCharts alternative for screening US-listed stocks and ETFs by fundamental and technical filters and reading the day's market moves on heat maps
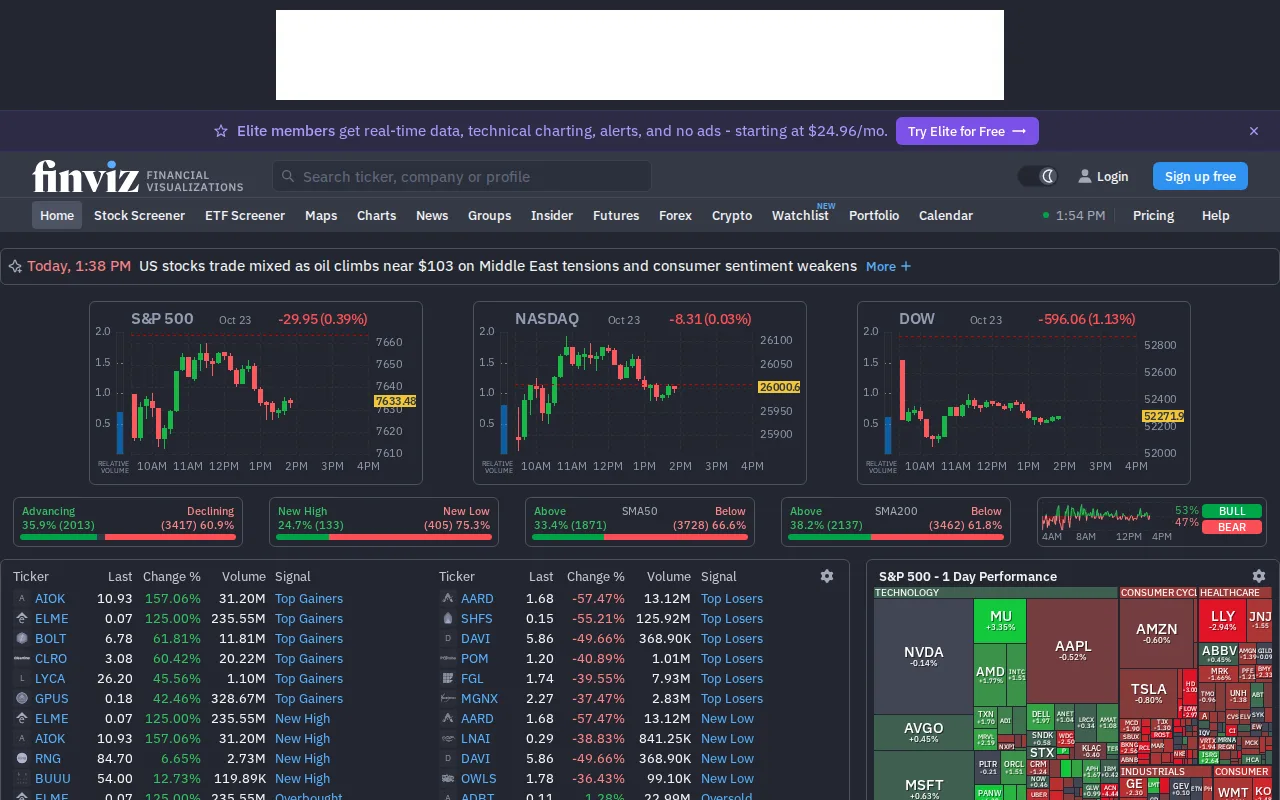
Finviz is the best StockCharts alternative for investors whose main job is screening US stocks, because Finviz gives the screener away. Finviz's free registered plan includes the screener with basic filters and 50 saved presets, the S&P 500 heat map, insider-trading tables and news, where StockCharts Free has no scans, saved charts or alerts. Finviz Elite costs $24.96/month billed annually ($39.50 month to month), less than StockCharts Extra's $27.65, and includes real-time quotes with pre-market (4:00-9:30 AM) and after-hours (4:00-8:00 PM) data, where StockCharts charges $9.95/month per market for official real-time data. Elite also adds unlimited alerts, 8 years of financials, 12-chart layouts with automatic pattern recognition, and Excel/CSV export and API access, and refunds are available within 30 days where StockCharts charges are non-refundable. Finviz's learning curve is rated low against StockCharts' moderate. StockCharts is still the better choice for chart-heavy technical work and non-US markets: Finviz covers only stocks and ETFs listed on NASDAQ, NYSE and AMEX, where StockCharts adds Canadian, UK and Indian stocks plus mutual funds and bonds; Finviz's listing has no Point & Figure charts, Relative Rotation Graphs or price history back to 1980; and Finviz has no mobile app, where StockCharts has an iOS app.
Compared to StockCharts: a free screener with 50 saved presets where StockCharts Free has no scans, Elite at $24.96/month with real-time pre-market and after-hours quotes included, and coverage limited to US-listed stocks and ETFs
Wins:Free registered plan includes the screener, 50 saved presets, the S&P 500 heat map and insider-trading tables, where StockCharts Free has no scans, saved charts or alerts · Elite at $24.96/month billed annually includes real-time quotes with pre-market and after-hours data and unlimited alerts, against StockCharts Extra at $27.65 plus $9.95/month per market for official real-time data · Excel/CSV export and API access on Elite, refunds within the first 30 days, and a low learning curve against StockCharts' moderate
Loses:Covers only stocks and ETFs listed on NASDAQ, NYSE and AMEX, where StockCharts adds Canadian, UK and Indian stocks plus mutual funds and bonds · No Point & Figure charts, Relative Rotation Graphs, SCTR rankings or ChartSchool-style tutorials in the listing · No native mobile app, where StockCharts has an iOS app, and the free plan has ads and 1-minute delayed quotes
Pros
- The free tier needs only registration and includes the screener, heat maps, insider and news pages.
- Elite adds real-time quotes plus pre-market (4:00-9:30 AM) and after-hours (4:00-8:00 PM) data.
- Elite exports screener results, portfolios and price data to Excel or CSV, or through an API, for your own workflows.
- Elite sends unlimited email and push alerts for price moves, news, ratings, insider trades, SEC filings and new screener matches.
Cons
- US markets only: NASDAQ, NYSE and AMEX, with no stated plans to expand.
- The free version shows ads, 1-minute delayed quotes and only 3 years of financial statements.
- No native mobile app; phones use the desktop-oriented website.
- The Elite free trial requires a credit card and converts to a paid plan automatically.
Pricing: Free tier · paid from $24.96/mo — Finviz Elite at $24.96/month billed annually ($39.50 month to month) vs StockCharts Extra at $27.65/month billed annually ($29.95 month to month) (verified )
4Tickeron — best StockCharts alternative for getting machine-generated entry, target and stop ideas for US stocks and ETFs from AI robots and pattern scanners instead of charting setups by hand
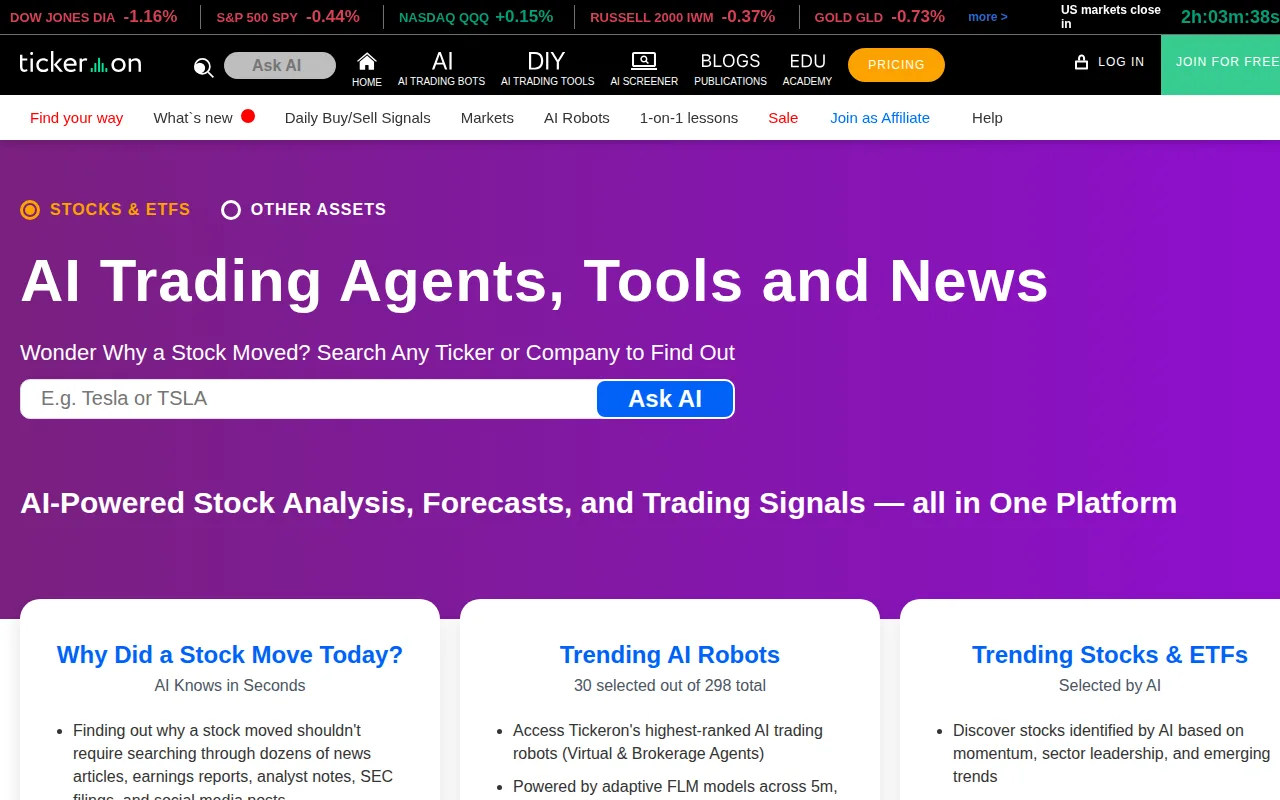
Tickeron is the best StockCharts alternative for investors who would rather have machine-learning systems propose trades than read scan results themselves. Tickeron's AI Robots publish entries, exits, targets and confidence levels for US stocks and ETFs on 5-, 15- and 60-minute timeframes, and Autopilot copies each trade into a paper-trading account. AI Real-Time Patterns rescans thousands of stocks and ETFs every minute for $20/month, while the Pattern Search Engine detects 39 end-of-day pattern types and the Trend Prediction Engine forecasts next-week and next-month direction for 7,000 stocks and 3,000 ETFs, at $30/month each after a 14-day free trial. Tickeron has a free account and ships iOS and Android apps, where StockCharts has no Android app, and Tickeron's Android app holds 4.0/5 from 307 reviews against StockCharts' 2.8/5 from 49 iOS ratings. StockCharts is still the better choice for investors who want to understand their charts and see clear prices: Tickeron's promoted returns are simulated backtests by its own disclaimers, its AI Robots plan prices appear only inside a signed-in account, and stacking its three published tools costs $80/month, above StockCharts PRO at $46.11/month billed annually. Tickeron's iOS app holds 1.8/5 from 17 ratings.
Compared to StockCharts: AI robots that publish ready-made trades instead of scans you review yourself, iOS and Android apps against iOS only, and simulated performance with robot-plan prices shown only after sign-in
Wins:AI Robots publish trades on 5-, 15- and 60-minute timeframes with entries, exits, targets and confidence levels, and Autopilot follows them in a paper-trading account · Real-Time Patterns rescans thousands of stocks and ETFs every minute on timeframes down to 5 minutes, where StockCharts' scheduled scans run daily · Android and iOS apps, with the Android app at 4.0/5 from 307 reviews against StockCharts' 2.8/5 from 49 iOS ratings and no Android app
Loses:Promoted returns are simulated, backtested results designed with hindsight, as Tickeron's own disclaimers state · AI Robots plan prices appear only after sign-in and tool prices carry no verification date, where StockCharts publishes every tier from $18.42/month · Tools are billed separately, so the three published tools total $80/month, above StockCharts PRO at $46.11/month billed annually, and coverage centers on US stocks and ETFs
Pros
- Each AI tool comes with a 14-day free trial before billing at $20-$30/month.
- Real-Time Patterns rescans thousands of stocks and ETFs every minute and reports breakout price, target and confidence level.
- Trend Prediction Engine covers 7,000 stocks and 3,000 ETFs with next-week and next-month forecasts and historical hit statistics.
- AI Robots can be followed in a paper-trading account through Autopilot before risking money.
Cons
- Robot plan prices are not public; the site's Pricing link opens a membership page that shows plans only inside the app.
- Promoted returns are simulated, backtested results rather than audited live performance.
- Tools are billed separately, so a full toolkit means stacking several subscriptions.
- The iOS app has not been updated since February 2023 (version 1.2) and is rated 1.8/5 from 17 ratings.
Pricing: Free tier · paid from $20/mo — Tickeron AI Real-Time Patterns at $20/month (all three published tools $80/month) vs StockCharts Basic at $18.42/month and PRO at $46.11/month billed annually
5SnapPChart — best StockCharts alternative for getting a second opinion on a momentum or breakout setup from a chart screenshot right before entering a trade
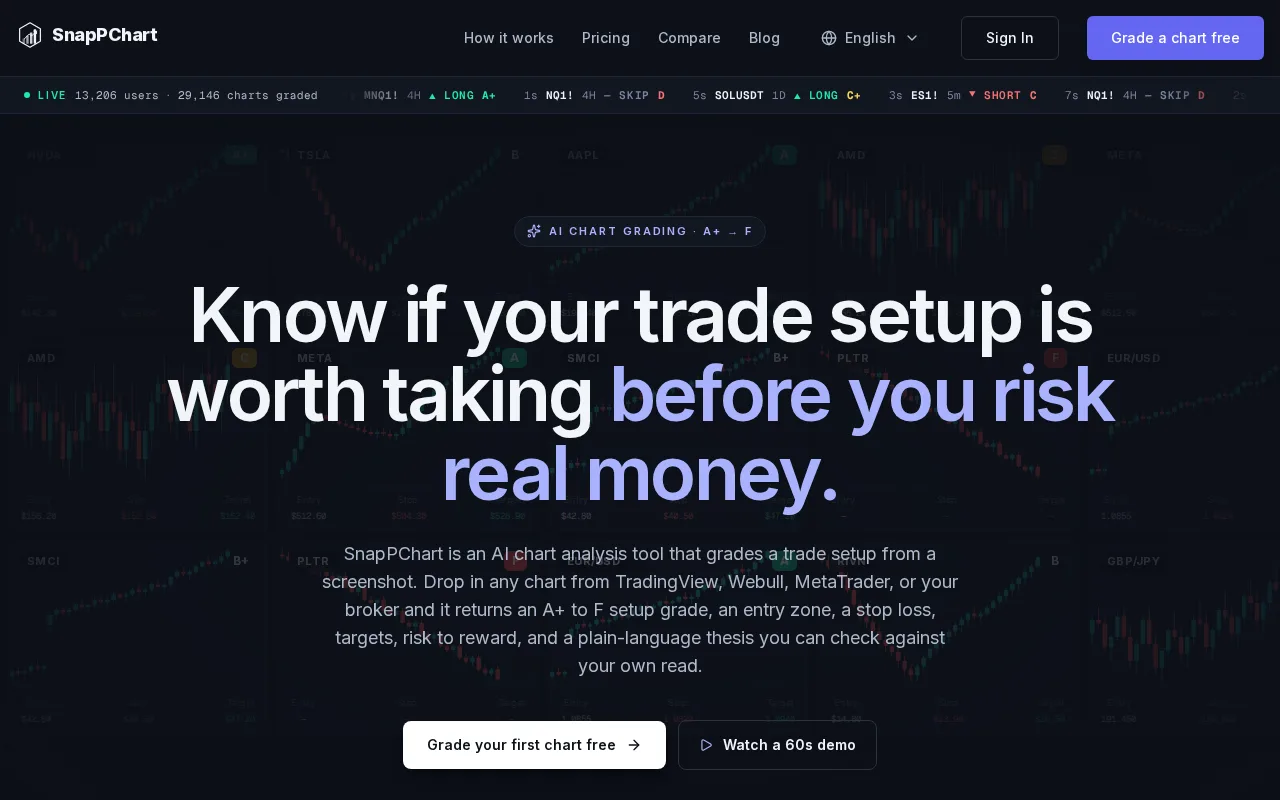
SnapPChart is a narrow StockCharts alternative: SnapPChart does not chart, scan or store watchlists, but it grades a single momentum or breakout setup from a screenshot in one step. A trader uploads a chart image from TradingView, Webull, ThinkOrSwim, Robinhood, IBKR or MetaTrader, and SnapPChart returns an A+ to F grade, a long or short read, a take, wait or skip call, and an entry, structural stop, targets, risk/reward and bear case when the chart supports a plan. SnapPChart's yearly plan works out to $16.67/month for unlimited grades, below StockCharts Basic's $18.42, $4.99 buys a single week of 15 grades, and SnapPChart's learning curve is rated low against StockCharts' moderate. SnapPChart works best as a check on setups found elsewhere, and StockCharts is the better choice for nearly every research task. SnapPChart reads only the uploaded image, with no live data, market scanning, backtesting or order execution, where StockCharts scans 50,000+ symbols, alerts by email, text or web notification and keeps price history back to 1980. SnapPChart has no free plan beyond one trial grade that hides the entry, stop and targets, against StockCharts Free; it runs on the web only; and it is supported by a single developer over email.
Compared to StockCharts: an A+ to F grade with entry, stop and targets from one screenshot instead of charts and scans, unlimited grades at $16.67/month on Yearly against Basic's $18.42, and no live data, market scanning or price history of its own
Wins:Returns an A+ to F grade, a take, wait or skip call, entry, structural stop, targets, risk/reward and a bear case for a single setup, which StockCharts' listing does not produce · Yearly plan gives unlimited grades for $199.99 ($16.67/month), below StockCharts Basic at $18.42/month billed annually, and $4.99 buys one week · Low learning curve against StockCharts' moderate, and grades screenshots from TradingView, Webull, ThinkOrSwim, Robinhood, IBKR and MetaTrader
Loses:Reads only the uploaded image: no live data, charts, market scanning or backtesting, where StockCharts scans 50,000+ symbols and draws its own charts · No free plan beyond one trial grade with the entry, stop and targets hidden, where StockCharts has a free plan · Web only, supported by a single developer over email, and grades describe one moment rather than a tested win rate
Pros
- Works with screenshots from TradingView, Webull, ThinkOrSwim, Robinhood, IBKR and MetaTrader 4/5.
- Returns entry, stop, targets, risk/reward and the case against the trade, not only a letter grade.
- Trader Profile adjusts grades for scalp, day or swing style, market, and long-only or short-only bias.
- Low-commitment entry: $4.99 buys a week of 15 graded setups, and every plan cancels anytime.
Cons
- Reads only the uploaded image: no live data, market scanning, backtesting or order execution.
- The free trial is one grade per account and hides the entry, stop and targets.
- Weekly and Monthly plans cap grades at 15 per week and 100 per month; only Yearly is unlimited.
- Built and supported by a single developer, with email support and no support team.
Pricing: From $4.99/mo — SnapPChart Yearly at $16.67/month ($199.99/year) or Monthly at $19.99 vs StockCharts Basic at $18.42/month billed annually ($19.95 month to month) (verified )